vrijdag 6 december 2019

Differentiating real signals from spurs in the tiny spectrum analyzer

When measuring the harmonics from my Softrock Ensemble RXTX I noticed a number of strange (e.g. non harmonic) signals such as at 0.8MHz , 9MHz, 12.8MHz and 13.8MHz
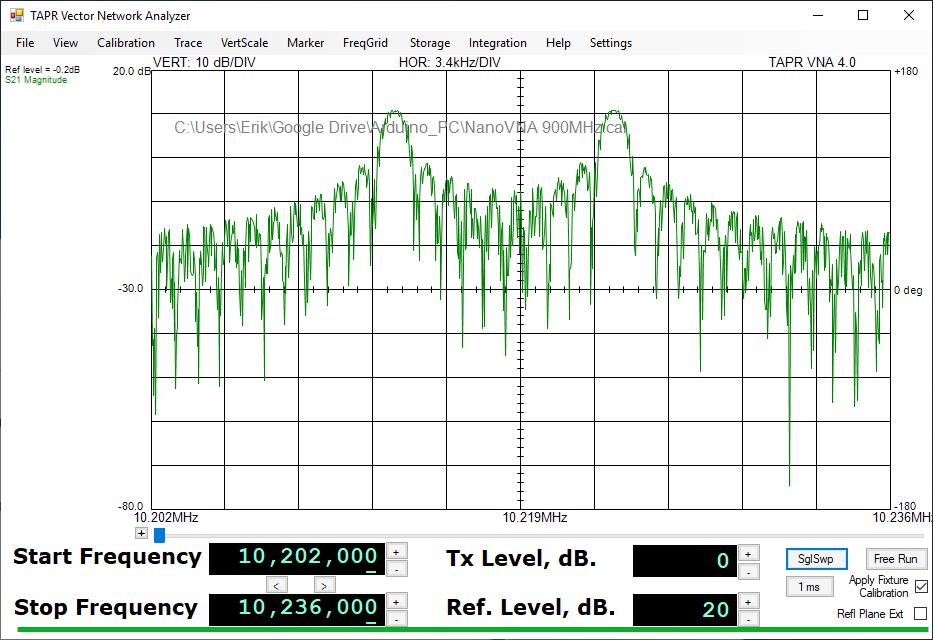
Is the output of the RXTX really that bad, or are these spurs and mirrors? Below is a 4 times averaged scan of the output of the TXRX through a 60dB attenuator with RBW set to automatic


When wobbling the first IF around 433MHz, real input signals should stay at the same frequencies but mirrors or internally generated spurs may change to different frequencies or disappear altogether.
This is possible because  the 434MHz IF filter is about 1MHz wide , much wider than the currently selected RBW bandwidth of about 20kHz.
Luckily I implemented this wobbling for the 2GHz spectrum analyzer and I could enable it by switching on "Spur Reduction"
Combined with 4 times averaging this positions the 434MHz IF at 4 different frequencies, still within its 1MHz bandwidth but twice the RBW apart and the averaging should reduce the signals that change position in the scan.
The impact is easily seen as most spurs and mirrors almost disappear giving confidence the RXTX is not that bad.


There is some different in the amplitude of the real signals at 7.11MHz and 14.22MHz as the IF filter at 434MHz is not really a flat top filter and the calculated IMD changes a bit but the difference (about 1dB) is acceptable
The SW spur reduction nicely compensates for the absence of good HW filtering and helps to keep the tiny spectrum analyzer small and easy to build.

maandag 2 december 2019

Further tuning of the 2GHz cavity filter

Some more tuning resulted in a nice flat top of the pass band


At least flat within 0.5dB
Center frequency at 2020.7MHz, 
S21 -5.1dB
-3 dB width 3.3MHz
-40dB width 14MHz

Tiny home build spectrum analyzer

Building and tuning GHz cavities is not everyone's hobby but if you need a zero till a couple of hundred MHz spectrum analyzer there is a much simpler build possible.


This is all you need to measure signals between  0 and 400MHz at levels between -80dbm and -20dBm
Top blue module is a mixer. Can be found on eBay either as complete module (ADE-1) for 10$ of you only buy the mixer (AD-25MH (much better level 13 mixer), 5pc for 4$) and put it on a small PCB
The two small identical blue modules are SI4432 modules (do NOT use SI4463 modules as these use non overlapping bands) that can be found on eBay for less than 2$
The one directly connected to the mixer acts as a tunable LO with 20dBM  output between 433MHz and 860MHz
The copper module is a 433MHz band pass filter you either buy from eBay for 25$ or build yourself from two EPCOS SAW filters and two SMD inductors for less then 10$
Datasheet here
The bottom blue module is the receiver SI4432. Its set at a fixed frequency of 433MHz and does the the logarithmic signal strength measurement. The officiel range is -120dB till 0dB but the range is limited in practise between -100dBm and -20dBm as above -20dBm the SI4432 will start to produce all kind of intermodulation products. 
The module with the USB plug is an Arduino zero compatible to provide the 3.3Volt and to control the SI4432 modules (these need 3.3V MISO/MOSI/CLK)

Some real measurements
Scan from 0 to 5MHz


The phase noise of the LO SI4432 is very visible but the 3kHz RBW results in a nice sharp peak. The noise floor is not very flat but no spurs
The AD9851 clearly delivers a nice clean signal at 1MHz through 40dB of attenuators

Switching to 0-100MHz you get


RBW now set to 300kHz. Output of the same AD9851 at 46MHz
Some small spurs but contrary to cheap "spectrum analyzers" you can buy on eBay which are basically nothing more than a LO, a mixer to DC, a LF RBW filter and a log detector, this SA does not have the many spurs from the harmonic modes of the LO due to proper filtering. The second harmonic from the AD9851 at 92MHz is clearly visible

And for the full range


This is the output of a ADF4351 at 75MHz. The harmonics at 150MHz and 225MHz are visible but sensitivity quickly reduces above 200MHz as I did not yet remove the low pass filter at the output of the LO module so the mixer loses its LO at higher frequencies. The spur at 30MHz is probably an alias from the ADF4351 signal as there is no low pass filter at the input yet.

The datasheet of the SI4432 can be found here
And this is the module used

For SW you can go to github as there are several repositories that contain usable libraries.

Hope this inspires some creative use of the SI4432 module

vrijdag 29 november 2019

Measuring S11 and S21 of the home build cavity filter

To complete the building I measured the S21 of the cavity filter
First the pass band


As the home build GHZ VNA does not have any shielding the dynamic range is rather limited but the -3dB bandwidth is about 4MHz and the loss is -3dB. From other measurements its clear the suppression of the image at 21.4MHz offset is good enough.
Certain cavity filters do have harmonic modes that will allow 2nd or higher order harmonics to pass.
I can only measure S21 till 4.3GHz so here is a wide sweep.


The peak at 4.3GHz is an artifact of my SW, its not there when you zoom in. So the choice of an interdigital filter instead of a comb filter enabled the suppression of harmonics modes

The S11 measurement shows there is still some room for improvement


but for now I'm happy.

woensdag 27 november 2019

Building an tuning a narrow 2GHz interdigital filter

During my 2 GHz SA experiments it became more obvious that having three IF's (2.5GHz, 110MHz and 10.7MHz) was leading to all kind of problems so I went looking for a very narrow band cavity filter. To be able to go from above 2GHz directly to 10MHz the 20MHz offset suppression  should be more then 90dB. I could not find a filter with these specs.
According to this calculator it should be possible to build a 5 resonator interdigital filter at 2 GHz with acceptable loss and narrow enough so I decided to build it. As I have no access to a machine shop I followed the construction proposed  on another web site and using the square tube and the input/output antenna's from the later and I build the calculated filter from the first link.
Result is a 5 resonator interdigital filter in a square aluminium tube with solid copper resonators as can be seen in this picture

You can just see the input antenna and two copper resonators with their tuning screws
The only special tool I used was a 4mm wire tap for attaching the resonators and the tunng screws.
After building the real problem start. A filter of this order will not let anything through if not tuned correctly. I could not find how other people did this initial tuning so I created a field sensor as shown in this picture

It was small enough to be inserted from one side of the filter past all the untuned resonators till the resonator up for tuning so I could tune one resonator at a time.
The end result was a 2MHz 3db bandwith at 2.016Ghz and sufficient suppression at 20MHz offset to ommit my 110MHz IF.
This led to an updated SA with this block diagram


Short specs; 0-2GHz input, 0-30dB attenuator IP3 at +17dB with 0dB attenuator. Noise floor around -100dB with 300kHz bandwidth, 300/30kHz HW resolution filters and FFT resolution filters down to 1Hz. Almost no spurs.
You can see the full set of components in this picture


As the ADF4351 have two outputs I added a 3GHz bridge and a triple receiver so the HW doubles as a 35MHz till 3GHz VNA
The unmarked module at the left bottom is a third ADF4351 that can be used is mixed (0-2GHz) or direct (35MHz-2GHz) tracking generator
I hope this inspires more people to build their own GHz cavity filters

maandag 9 september 2019

NanoVNA usable as spectrum analyzer???

If you ignore the phase any signal presented at port 2 should be mixed with the CLK2 and create some response.
As a test I applied a 10MHz -50dBm signal. This resulted in the first measurement..


You see the double peak,each about 2kHz wide, caused by the mixing with CLK2 and the single frequency FFT at +/-5kHz on top of the noise like hump of about 48kHz wide. The 48kHz is related to the sampling rate of the ADC. If you increase the sampling rate the hump widens proportionally

When removing the test signal the noise floor is flat at -90dB, excellent clean signal!

With a 0dBm test signal you get the second measurement.


Basically the same picture and no compression underpinning the huge dynamic range of the SA612 and the ADC.

But what is causing the "noise" hump under the two peaks?
This becomes obvious when zooming in as can be seen in the third measurement.


The emerging pattern is spectral bleeding in the FFT you get when you do not apply a good window function and the input signal is not perfectly aligned in a multiple of full cycles. So it is in reality a consequence of the test signal not being exactly matched with the mixer LO and the FFT size. Not a problem when doing regular VNA measurements because then the alignment is perfect by design.

So all is understood now and we can test a 20MHz wide scan and see if we get a nice single peak at 10MHz. This resulted in the fourth measurement scanning with 1000 points so each "dot" is 10kHz apart


The 10MHz peak is there, somewhat lower due to not perfectly fitting into one of the 2kHz wide frequency samples, scanning only 5MHz would have solved that problem.
But there are many many more peaks around 30dB lower then the 10Mhz signal. Removing the input signal gives a nice clean noise floor with no peak above -75dBm. The peaks you get are all result of all kind of harmonics of CLK2 and the input signal mixing in various modes. a real spectrum analyzer does not have this problem because of the LO/IF choice and the various filters

So, yes, you can use the NanoVNA as a spectrum analyzer but you have to know very well what you are doing and how to interpret the measurement.

woensdag 26 juni 2019

When to enable low spur mode of the ADF4351

For some time I have been fine tuning my spectrum analyzer. Did some improvements like replacing the cavity filter with a much narrower version so the 10.7MHz second IF no longer creates spurs.
And I have replace the Ceramic 30kHz resolution with a 6 pole crystal filter with 40kHz bandwidth but much better form factor.
The total looks now like this with shielding removed:


The phase noise picture overall looked ok apart from some annoying spurs between 30kHz and 100kHz and many small spurs above 200kHz:


After trying many things I switched on the low spur mode of ADF4351 first and second LO and that did make a difference:


Although the phase noise around 30kHz went up with 5dB most of the spurs there did disappear. Did not yet look into the spur at 150kHz
For the many spurs above 200kHz, these are caused by the PC and its USB peripherals as the unconnected Audio input has low noise floor but as soon as connected to the Spectrum Analyzer the noise goes up 20dB.
One small step completed, many to go, the journey is the goal.