As a test I applied a 10MHz -50dBm signal. This resulted in the first measurement..

You see the double peak,each about 2kHz wide, caused by the mixing with CLK2 and the single frequency FFT at +/-5kHz on top of the noise like hump of about 48kHz wide. The 48kHz is related to the sampling rate of the ADC. If you increase the sampling rate the hump widens proportionally
When removing the test signal the noise floor is flat at -90dB, excellent clean signal!
With a 0dBm test signal you get the second measurement.

Basically the same picture and no compression underpinning the huge dynamic range of the SA612 and the ADC.
But what is causing the "noise" hump under the two peaks?
This becomes obvious when zooming in as can be seen in the third measurement.
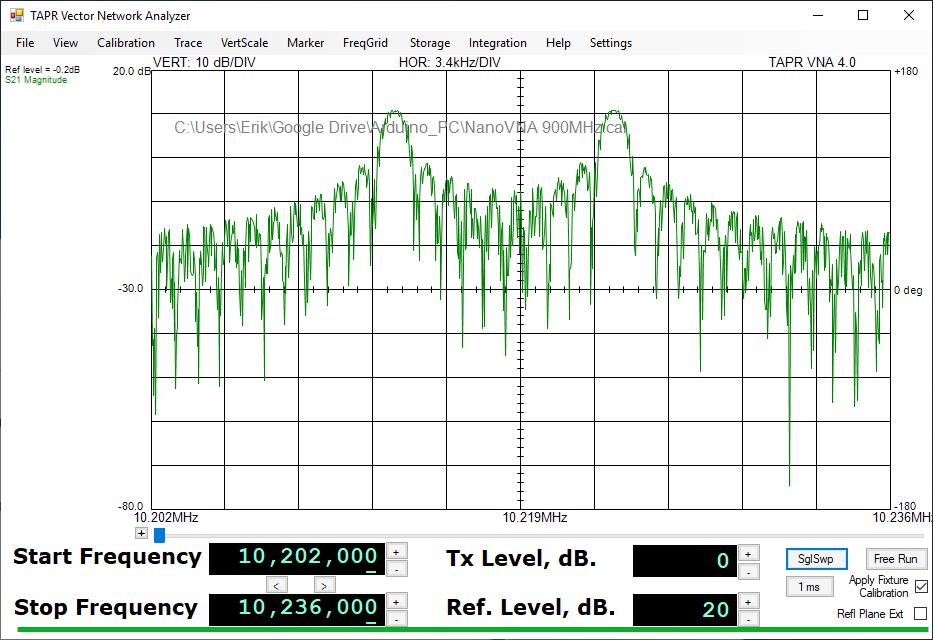
The emerging pattern is spectral bleeding in the FFT you get when you do not apply a good window function and the input signal is not perfectly aligned in a multiple of full cycles. So it is in reality a consequence of the test signal not being exactly matched with the mixer LO and the FFT size. Not a problem when doing regular VNA measurements because then the alignment is perfect by design.
So all is understood now and we can test a 20MHz wide scan and see if we get a nice single peak at 10MHz. This resulted in the fourth measurement scanning with 1000 points so each "dot" is 10kHz apart

The 10MHz peak is there, somewhat lower due to not perfectly fitting into one of the 2kHz wide frequency samples, scanning only 5MHz would have solved that problem.
But there are many many more peaks around 30dB lower then the 10Mhz signal. Removing the input signal gives a nice clean noise floor with no peak above -75dBm. The peaks you get are all result of all kind of harmonics of CLK2 and the input signal mixing in various modes. a real spectrum analyzer does not have this problem because of the LO/IF choice and the various filters
So, yes, you can use the NanoVNA as a spectrum analyzer but you have to know very well what you are doing and how to interpret the measurement.
Geen opmerkingen:
Een reactie posten